Projects
A selection of data and research projects.
County Health Dashboard
Built an interactive dashboard combining air quality indices, PFAS exposure levels, and public health indicators across U.S. counties. The goal was to surface environmental-health correlations in a format accessible to researchers and policymakers.
View dashboard → Read on Medium →Colorado Latino Presence Analysis
Used American Community Survey and decennial census workflows to study demographic, economic, and household patterns across Colorado counties. Focused on shifts in population distribution, income, and labor force participation over a 20-year window.
Run4Office with NationBuilder
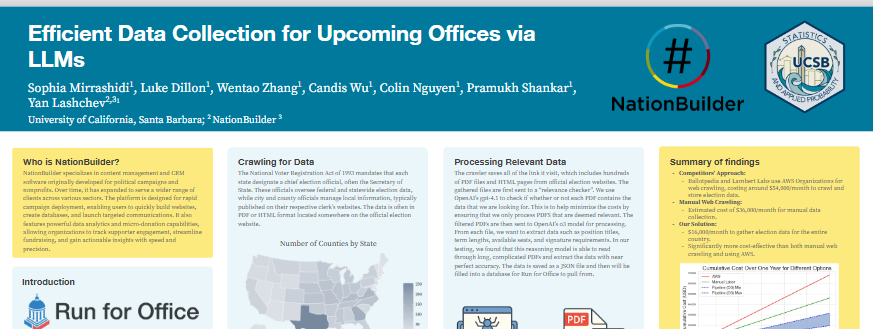
Built a civic information platform that aggregates open election positions by county, helping communities and local governments make local office opportunities easier to discover and act on.
View project →Environmental Exposure & Cancer Risk
Analyzed relationships between environmental contaminant exposure data and cancer incidence rates at the county level. Combined EPA, CDC, and SEER datasets to model risk factors while controlling for demographic and socioeconomic variables.
View GitHub →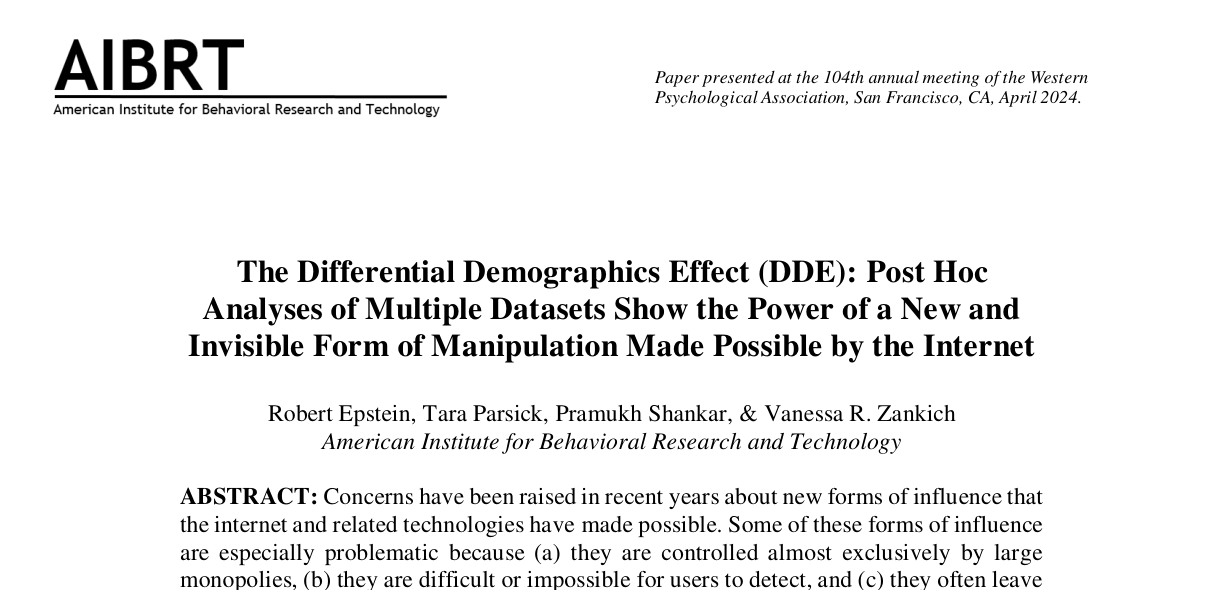
Differential Demographics Effect (DDE)
The paper introduces the Differential Demographics Effect (DDE), a form of online influence in which the same content can produce predictable differences across demographic groups when response patterns and population proportions are known.
The analysis highlights why this kind of influence can be difficult to detect: because every group receives identical content, the resulting demographic margin can remain invisible to users and hard for authorities to trace.
View Epstein et al. PDF →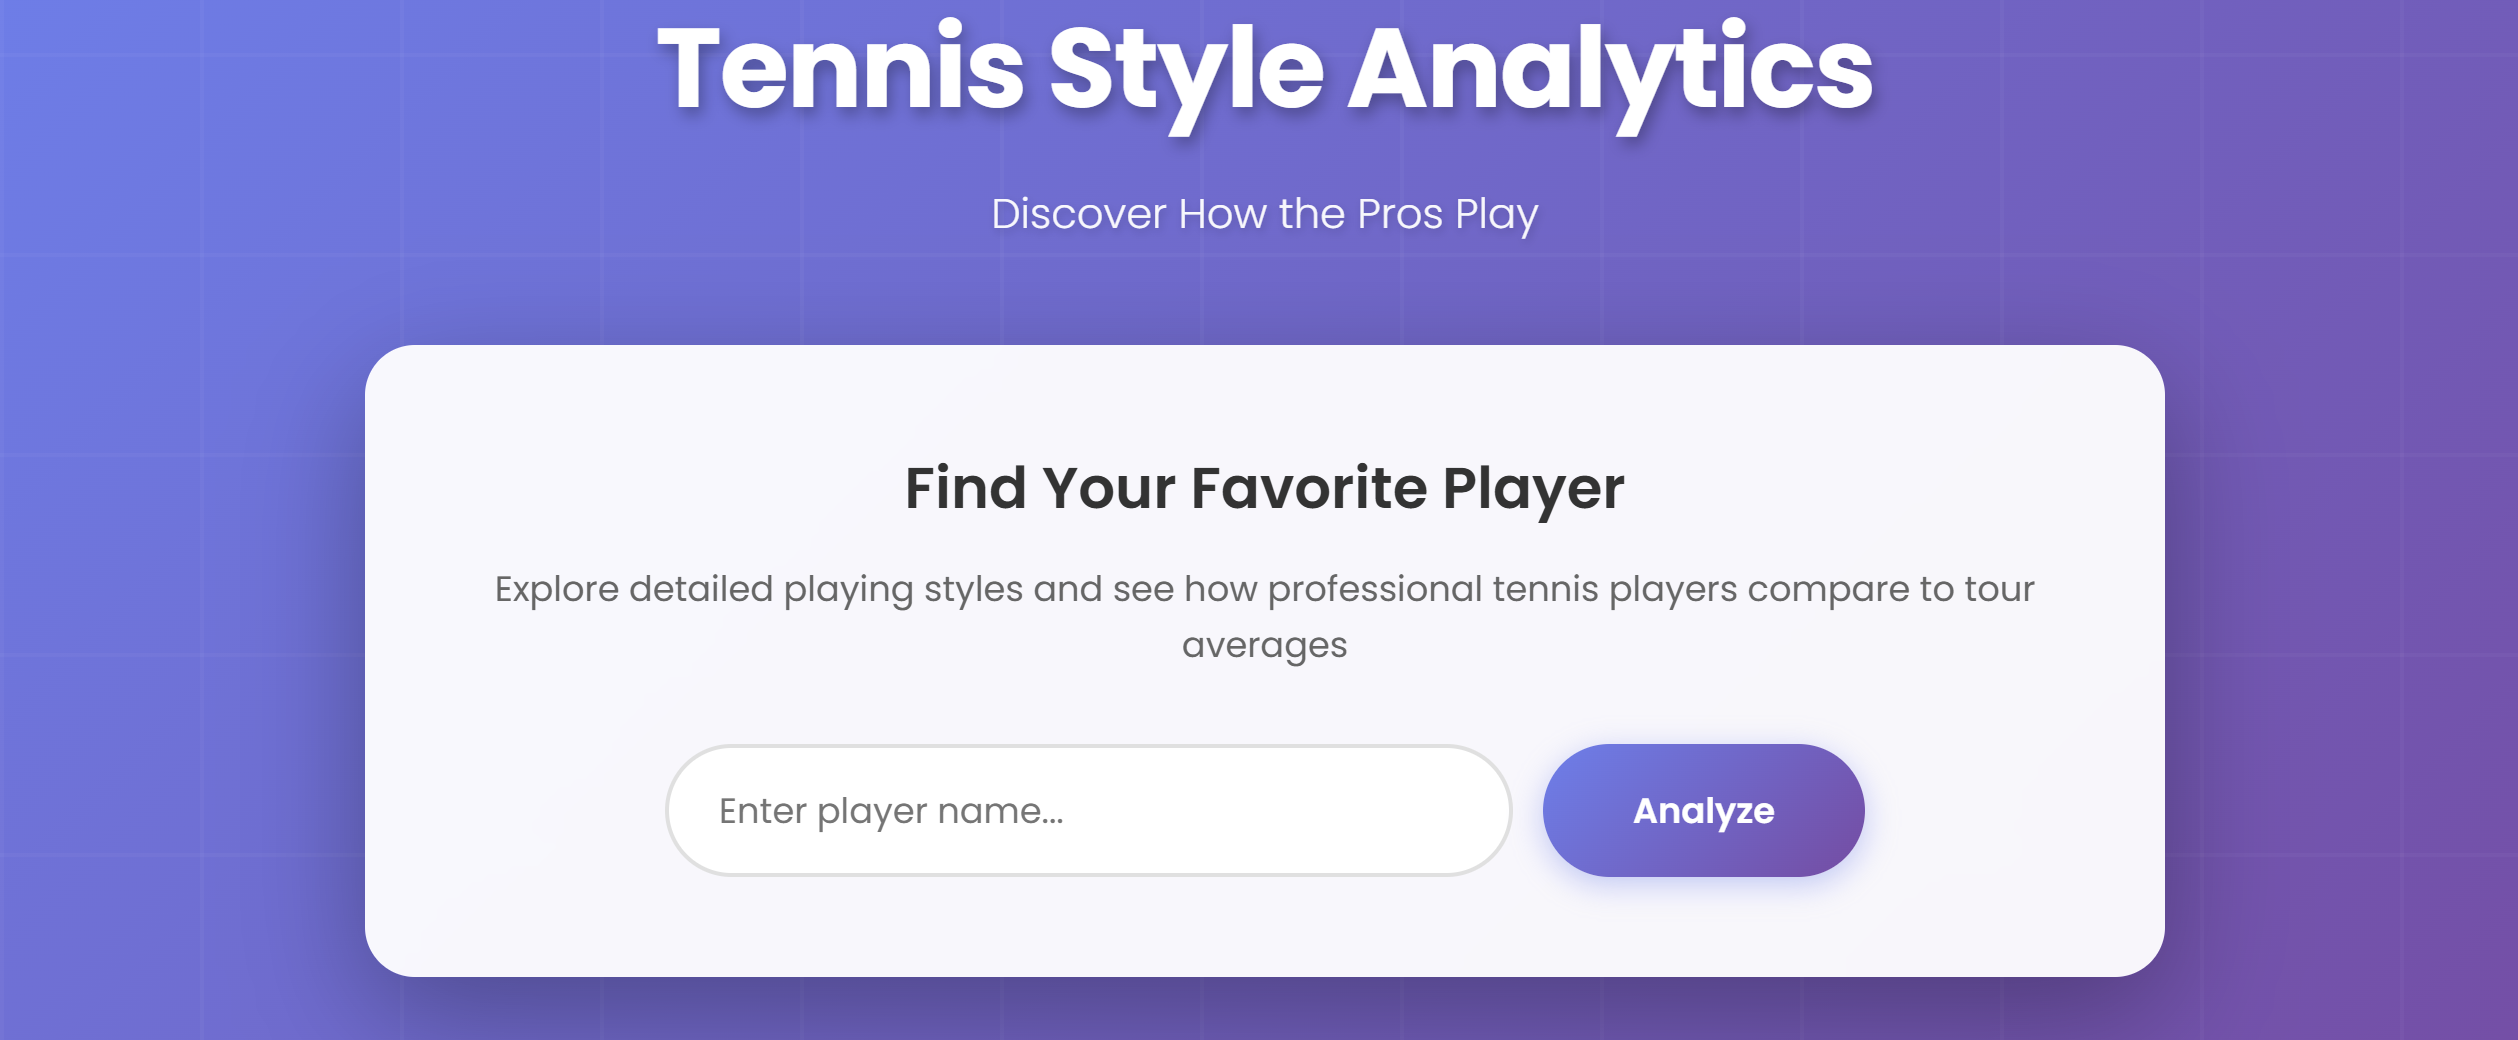
Classifying Tennis Player Styles
An interactive web app that scrapes pro tennis match data from Tennis Abstract and classifies each player's style across three dimensions: rally length, shot frequency, and winner types. Players are benchmarked against tour averages in real time.
Rally length — players with shorter average points are labeled First-Strike (aggressive, looks to finish early); longer points earn the Grinder label (patient, comfortable in extended rallies).
Shot frequency — players are labeled Likes to hit Forehand, Likes to hit Backhand, or Likes to hit Groundstrokes based on their forehand/backhand split relative to the tour average.
Shot variety & net play — players above the tour average in slices, dropshots, or lobs earn the Variety tag; those who approach the net more than average are labeled Likes to go to net.
Data sourced from the Tennis Abstract match charting project.
View app →
Pokémon Type Prediction & Analysis
Two complementary analyses combined into one project. The prediction model trained Random Forest, Decision Tree, LDA, and KNN classifiers on 800+ Pokémon entries with 20+ attributes, achieving a ROC AUC of 0.69 and 28.2% accuracy — 5× above the random baseline.
The type analysis introduces two scoring metrics visualized in an interactive Tableau dashboard:
Cumulative Defense score — sum of all damage multipliers received by a type combination (1 = neutral, 2 = super-effective, 4 = double super-effective, 0.5 = resist, 0.25 = double resist, 0 = immune). A lower score is better, indicating more resistances and immunities.
Cumulative Coverage score — sum of the highest damage a type combination can deal against each individual type. A higher score is better, meaning the combination hits more types for super-effective damage.
View Tableau dashboard → View prediction model →How Can We Measure Nadal's Dominance at Wimbledon?
A statistical analysis of Rafael Nadal's performance at Wimbledon, exploring what metrics best capture his dominance on grass. The project examines win rates, match statistics, and opponent-adjusted performance across his Wimbledon career to further analyze his performance and see how his playing style has evolved.
View poster →